
The
This comes as social media intelligence platform Santiment says social sentiment data shows XRP is “experiencing the most fear, uncertainty and doubt (FUD) since October.”
😨 XRP (-31% in the last 2 months), unlike Bitcoin, has seen the most fear, uncertainty and doubt (FUD) since October, according to our social data.
🔴 Circles indicate days when there are abnormally higher BULLISH reactions compared to BEARISH reactions, over XRP (Greed Zone)… https://t.co/lJNW8zlRwK pic.twitter.com/ZoFmwrtw3h
— Santiment (@santimentfeed) December 4, 2025
“The last time we saw nearly this level of crowd fear was on November 21, and the price of XRP immediately rose 22% over the following three days,” it added.
XRP is the worst performing top 10 cryptocurrencies over the past 24 hours and is now down 42% from its July 2025 all-time high (ATH) of $3.65.
Despite a 7% decline in the past month, XRP is showing signs of recovery after rising 9% in the past two weeks. Can the Ripple Token Go Higher?
XRP Price Poised for a Sustainable Recovery
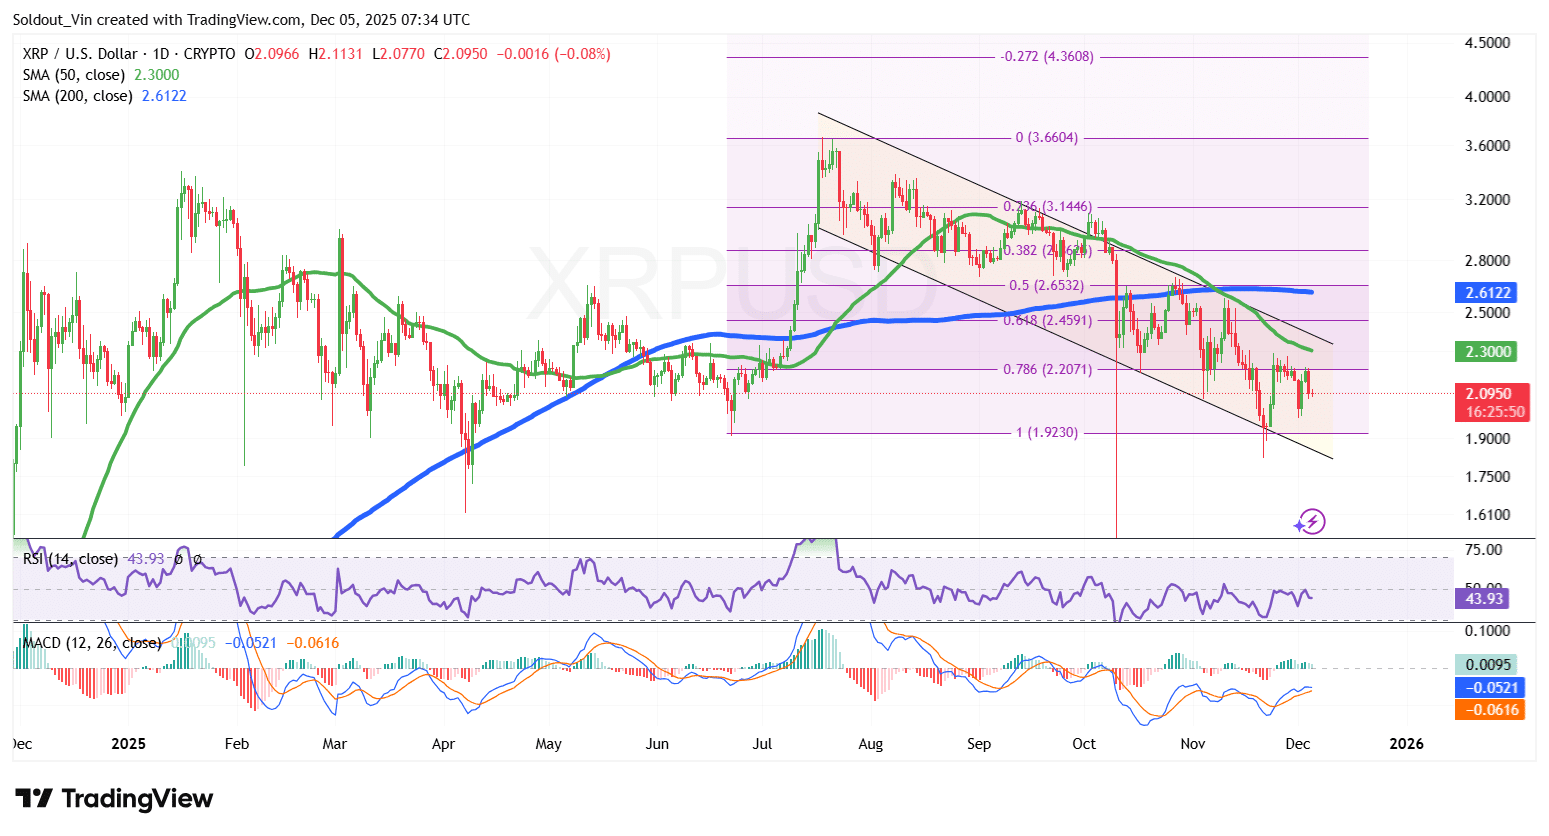
The XRP price rallied strongly in July, rising into the upper portion of the Fibonacci extension zone before losing bullish momentum near the $3.14–$3.66 resistance zone. This rejection marked the start of a downtrend as bears stepped in to secure gains.
As sellers took control, XRP broke below both the 50-day and 200-day Simple Moving Averages (SMAs). This decline was further fueled by a bearish trend structure that formed below the 200-day SMA around the $2.60 region, sending market sentiment into a sharp dive.
This bearish breakdown ultimately pushed
However, this key demand zone allowed buyers to re-enter the market. The price of
The Relative Strength Index (RSI) is also showing signs of bullish intent. After approaching oversold territory in late November, the RSI has rebounded and is now hovering around the 44 area, steadily moving back towards the neutral 50 level despite the consolidation around this zone.
Meanwhile, the Moving Average Convergence Divergence (MACD) indicator supports these early recovery signals. The blue MACD line has crossed the orange signal line and green histogram bars are starting to appear as bearish momentum cools, a clear signal of a potential shift despite the recent downtrend.
Ripple Token Poised for Recovery Towards Key Resistances
Based on the XRP/USD price analysis,
XRP has repeatedly respected the lower limit of its descending channel pattern, and the latest upswing suggests that momentum may be shifting.
A sustained recovery could see the Ripple token price climb higher into the highlighted supply zone between $2.80 and $3.10.
The first resistance level is at the 50-day SMA ($2.30), followed by the 200-day SMA ($2.61-$2.62), both levels acting as crucial barriers.
Conversely, if XRP’s price is rejected around the 50-day SMA, the token could still continue trading within the declining channel. In this bearish scenario, XRP could return to the key demand zone near $2.00-$1.92 as the buying momentum fades.
Related news:
Best Wallet – Diversify Your Crypto Portfolio

- Easy-to-use, feature-driven crypto wallet
- Get early access to upcoming token ICOs
- Multi-chain, multi-wallet, non-custodial
- Now in the App Store, Google Play
- Stake to earn native token $BEST
- 250,000+ monthly active users
#XRP #Price #Drops #Rising #FUD #Rally