
Bullish divergences are forming on the daily chart
Hedera Hashgraph began to show the first signs of recovery when a bullish divergence emerged on the daily time frame, a pattern identified by analyst Steph Is Crypto. Price formed lower lows, while the RSI moved in the opposite direction with higher lows, a setup that was often accompanied by weakening downward pressure. The difference indicates that sellers are losing momentum after a prolonged decline, even as the token continues to test a declining support zone.
HBARUSDT Chart | Source: x
The daily chart also shows Hedera reacting strongly to the lower trendline, where buyers entered the market after last week’s downturn. This response suggests a stronger defense at the base of the current structure. Market participants watching the spread are looking for a break above recent lower levels, which could indicate momentum is starting to shift after weeks of selling.
Support recovery near $0.14 strengthens price stability
Hedera regained the $0.14 level and analysts noted that the area now serves as important short-term support. The move followed a sharp downward test, with the price bouncing quickly after hitting lower levels. According to CryptoPulseThis recovery represents an early constructive sign as the market attempts to stabilize around a previously fractured zone.
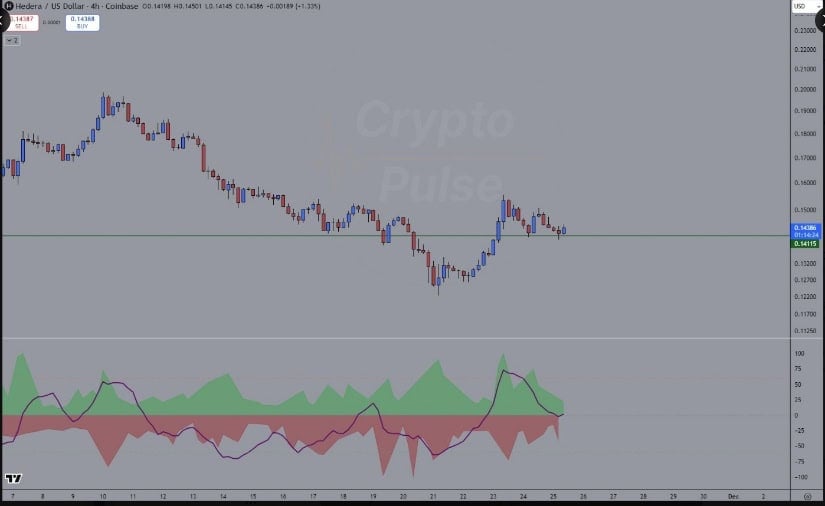
HBARUSD Chart | Source: x
The price is currently trading above the $0.14 range with stable behavior, positioning the level as a reference point for the short-term structure. CryptoPulse noted that this area offers improved risk-reward ratios for traders operating around major support levels. As long as the altcoin holds its ground above this reclaimed zone, the market structure will remain intact for a continued recovery attempt.
Momentum indicators point to early strength
In addition to the bullish divergence, there has been a shift in momentum on the VWRSI indicator, especially on the lower time frames. CryptoPulse reported that bearish pressure is easing as the momentum curve begins to tilt upward, signaling a transition from weakness to early accumulation. These developments usually appear on shorter time frames before being reflected on broader, higher time frame charts.
The RSI on the daily chart supports this view, with the indicator starting to rise from recent lows. This combination of stronger momentum metrics and a stabilizing price structure adds weight to expectations of continued consolidation and potential near-term progress. Analysts expect these trends to be closely watched, as indicator behavior often signals shifts before they appear on the chart itself.
Intraday structure shows steady recovery and reduced sales
According to BraveNewCoin, HBAR registered a modest recovery over the past 24 hours, regaining the $0.145 zone after an early session dip to $0.144. Buyers entered mid-session, sending the price action to the upper end of the intraday range. The token ended the trading period with a mild uptrend and formed higher lows in the second half of the session.

HBARUSD 24 Hour Chart | Source: BraveNewCoin
The volume profile provided further insight, showing a steady decline in activity as the day progressed. This volume decline coincided with reduced selling pressure, allowing the market to maintain stable intraday behavior. The gradual build-up of higher lows suggested controlled accumulation rather than rapid speculative buying, creating a more balanced environment after recent volatility.
The token is now at a point where continued stability above $0.145 could allow for a retest of the $0.146-$0.147 zone. If buyers maintain control at current levels, the structure may continue to strengthen as the bullish divergence and rising momentum indicators continue to develop.
#Hedera #Stabilizes #Bullish #Divergence #Rising #Momentum #Point #Reversal #Brave #Coin