
I’m putting a Santiment chart on X, Martinez declared that “whale activity on the Dogecoin network has fallen to its lowest levels in the past two months.” The chart tracks the price of DOGE against the number of transactions greater than $1 million. It shows frequent, large spikes in high-value transfers in early October 2025, when the price hovered around $0.27 at the top.
Dogecoin whales plummet sharply
On the day of the October 10 crash, the biggest spike occurred when more than 280 Dogecoin whales made a transaction. This was followed by a gradual decline until late October and November. On November 29, the bar for whale trades dropped to 3, while the price hovered around $0.15.
The decline has led to discussion about what this means for market structure and liquidity. In response to Martinez, analyst CryptoGames3D argued that “the decline in whale activity on Dogecoin could mean one of two things: either the whales hold out and wait, or they get out of the game; both cases come with risks. With the low liquidity of large holders, even a modest sell-off could push prices hard.” The comment underlines concerns that reduced participation from large entities could make the order book more vulnerable as conditions change.
Related reading
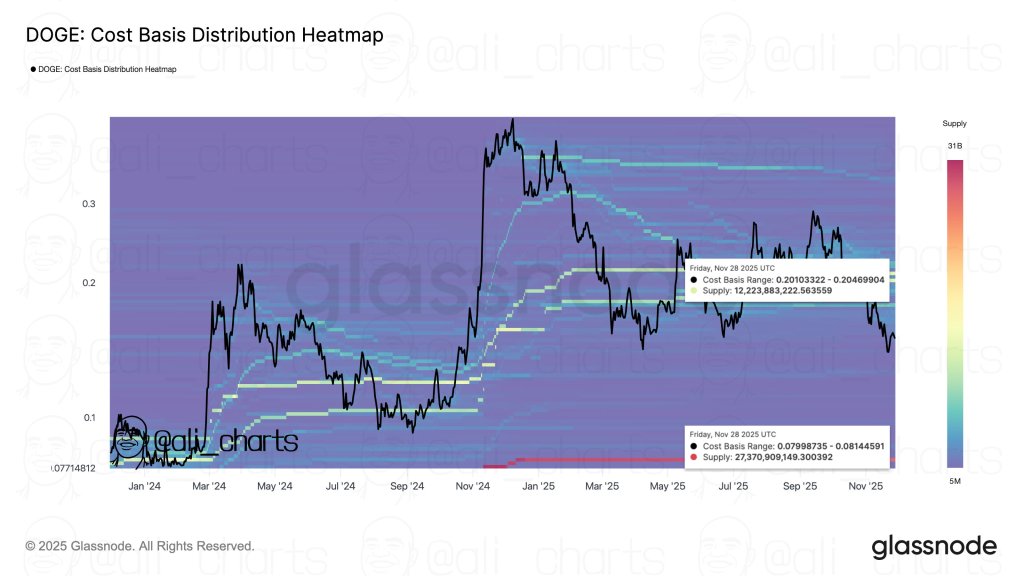
In a separate post on November 29, Martinez outlined what he called “key levels for Dogecoin DOGE,” citing “support at $0.08” and “resistance at $0.20.” These levels are reflected in a Glassnode cost-based distribution heat map he shared, which maps DOGE’s price since early 2024 against the realized price ranges where supply last moved.
Related reading
The heatmap reveals a dense cluster of supply around $0.08. A highlighted range between roughly $0.07999 and $0.08145 contains approximately 27.37 billion DOGE, marking it as a key support zone for realized prices. Higher up, a second but thinner band between about $0.20103 and $0.20470 contains about 12.22 billion DOGE, forming a significant resistance cohort. The color scale, which ranges from approximately 5 million to 31 billion DOGE, highlights how pronounced the lower cluster is relative to other price areas.
Taken together, the datasets form a tightly framed picture. DOGE is currently trading between a high long-term cost basis of around $0.08 and a resistance position around $0.20, while the number of transfers above $1 million has compressed to a multi-month low.
At the time of writing, DOGE was trading at $0.137.
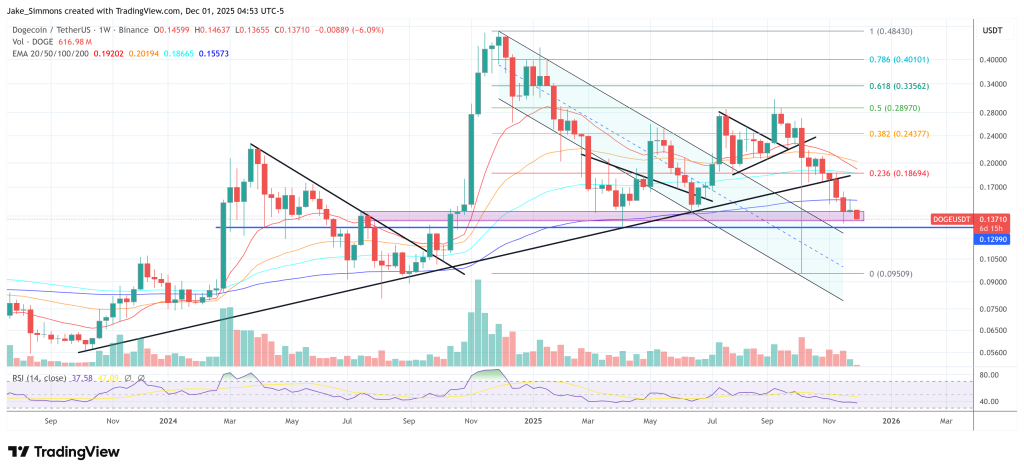
Featured image created with DALL.E, chart from TradingView.com
#Dogecoin #whale #activity #drops #deepest #level #months