
Nevertheless, BTC has recovered somewhat and is trading at around $87,000 at the time of writing this column. Before we start pronouncing the death of BTC and other cryptocurrencies, it would help to put things into perspective by looking at BTC’s performance as an asset over the past five years – especially compared to other popular assets.
The crypto crash in perspective
As the chart below shows, Bitcoin (BTC) has been in a cyclical bull market since November 2022, when it started rising from a low of around $16,400. Calculated at the recent high of about $124,000, that’s a gain of about 646% from low to peak in almost three years – from November 2022 to October 2025.
Source: Google Finance as of November 26, 2025
However, almost no one is lucky enough to buy at the low and sell at the high. So let’s take a look at the returns of BTC over different periods of the past five years:
| Time period | BTC absolute return (%) | Annual Return / CAGR |
|---|---|---|
| 6 months | -21% | Not applicable |
| Year to date | -7% | Not applicable |
| 1 year | -8% | -8% |
| 3 years | 427% | 62.23% |
| 5 years | 389% | 37.34% |
Source: Data collected from Google Finance on November 26, 2025
As the table above shows, BTC hasn’t done badly at all over the past three to five years, as long as you’ve weathered the usual ups and downs. If you had asked an investor five years ago, in November 2022, whether they would be happy with a compound annualized return of more than 35% on their investment, most would have happily accepted.
The best crypto platforms and apps
We’ve ranked the best crypto exchanges in Canada.
How does BTC returns compare to stocks, gold and silver?
While BTC’s returns look good in the table above, how has it performed compared to other popular investment assets?
Article continues below advertisement
X
| BTC | Gold (GLD) | Silver (SLV) | S&P 500 (.INX) | Nasdaq Composite (.IXIC) | S&P/TSX Composite (OSPTX) | |
|---|---|---|---|---|---|---|
| 5 year return | 389% | 126% | 121% | 86% | 88% | 77% |
| 5 year CAGR | 37.34% | 17.11% | 17.26% | 13.21% | 13.22% | 12.18% |
Source: Google Finance as of November 26, 2025
As evident from the table above, despite BTC’s sharp and dramatic decline over the past six weeks, BTC remains the best-performing asset among those popular with investors. It has even beaten the newsiest and come-from-behind success story of 2025: silver.
A simple five-year percentage chart shows what the comparative performance of these assets looks like. BTC is the blue line at the top and the others are merged below.
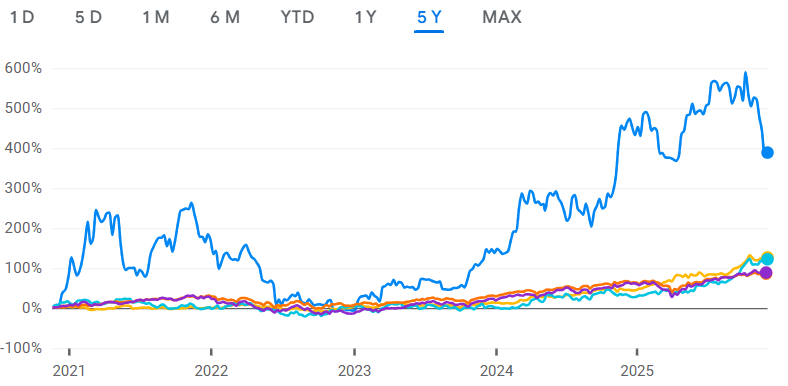
Source: Google Finance as of November 26, 2025
Will BTC’s recent fall continue or are we already off the bottom? There’s no way to know for sure; But if what we have now is a cyclical bear market (as opposed to a 35% correction within a bull market), I expect BTC to test its previous high of around $60,000 to $70,000 starting in 2021. This would be in line with BTC’s price performance in previous bear markets.
Is BTC’s Recent Fall Unusual and Worrying?
BTC may have been a leader among several asset classes over the past five years, but is the October-November crash unusual in its 15-year history? As the table below shows, that is not the case.
Crashes of 30% or more from peak are normal. As you can see in the table below, BTC has fallen 30% or more from all record highs eighteen times since 2010. This shows that BTC has always bounced back to new all-time highs.
How long has it taken to reach new highs after these periodic crashes? Between 8 and 1181 days! The range is wide and depends on whether we have seen the lows of this market cycle or not.
#decline #Bitcoin #remains #performing #major #asset #years #MoneySense