
Bitcoin price rose more than 1% over the past 24 hours to trade at $87,803 as of 2:45 a.m. EST, while trading volume rose 24% to $61.9 billion.
BTC reached the $87,000 level after the Bureau of Labor Statistics reported that the U.S. Consumer Price Index (CPI) for November rose 2.7% from a year earlier, below consensus expectations of 3.1%.
That strengthened hopes that the Federal Reserve would have more room to deliver results Additional interest rate cuts in 2026.
🚨BREAKING🚨
US #CPI inflation weakens to 2.7% in November, compared to an expected 3.1%https://t.co/2Qa6NLRqO5 pic.twitter.com/s8UfIHhDSy
— FXStreet News (@FXStreetNews) December 18, 2025
The core CPI also came in below expectations, rising 2.6% versus estimates of 3%.
Bank of Japan raises interest rates to the highest level in 30 years, the yen falls
But there was negative news from Asia, where the Bank of Japan (BOJ) announced a 25 basis point rate hike to 0.75%, the highest since 1995.
The decision passed unanimously 9-0, made after a two-day policy meeting. The increase was in line with market expectations.
BOJ Governor Kazuo Ueda cited growing confidence in the economic outlook as a key reason behind the rate hike.
🚨 BREAKING: 🇯🇵 BOJ DELIVERS THE WALK
Interest rates rose by 25 basis points to 0.75%, the highest level in 30 years.
Japan’s era of ultra-easy money continues to fade.
This is a major global LIQUIDITY shift… keep a close eye on the yen and risky assets. 👀 pic.twitter.com/vfciRH84WJ
— Wise Advice (@wiseadvicesumit) December 19, 2025
It was Japan’s second rate hike this year, following a 25 basis point hike in January, with policymakers indicating more hikes would follow.
Despite the rate hike, the yen fell to around 156 against the dollar, with markets already fully pricing in the rate hike.
Bitcoin price shows signs of bullish reversal
The BTC price traded above the $108,000 support level from July to October, a move that allowed the asset to reach its all-time high (ATH) around $126,230.
However, Bitcoin price subsequently underwent a correction within a descending channel pattern towards the lower boundary around the $84,000 support area. This area has allowed the price of BTC to consolidate within the upper bound, with $94,000 acting as a barrier on the upside.
The bearish stance has pushed BTC to trade below both the 50- and 200-day Simple Moving Averages (SMAs). This trend is fueled by the SMAs forming a death cross around $111,035.
Meanwhile, the Relative Strength Index (RSI) is showing signs of a recovery, currently at 43 and rising, an indication that buyers are regaining some control.
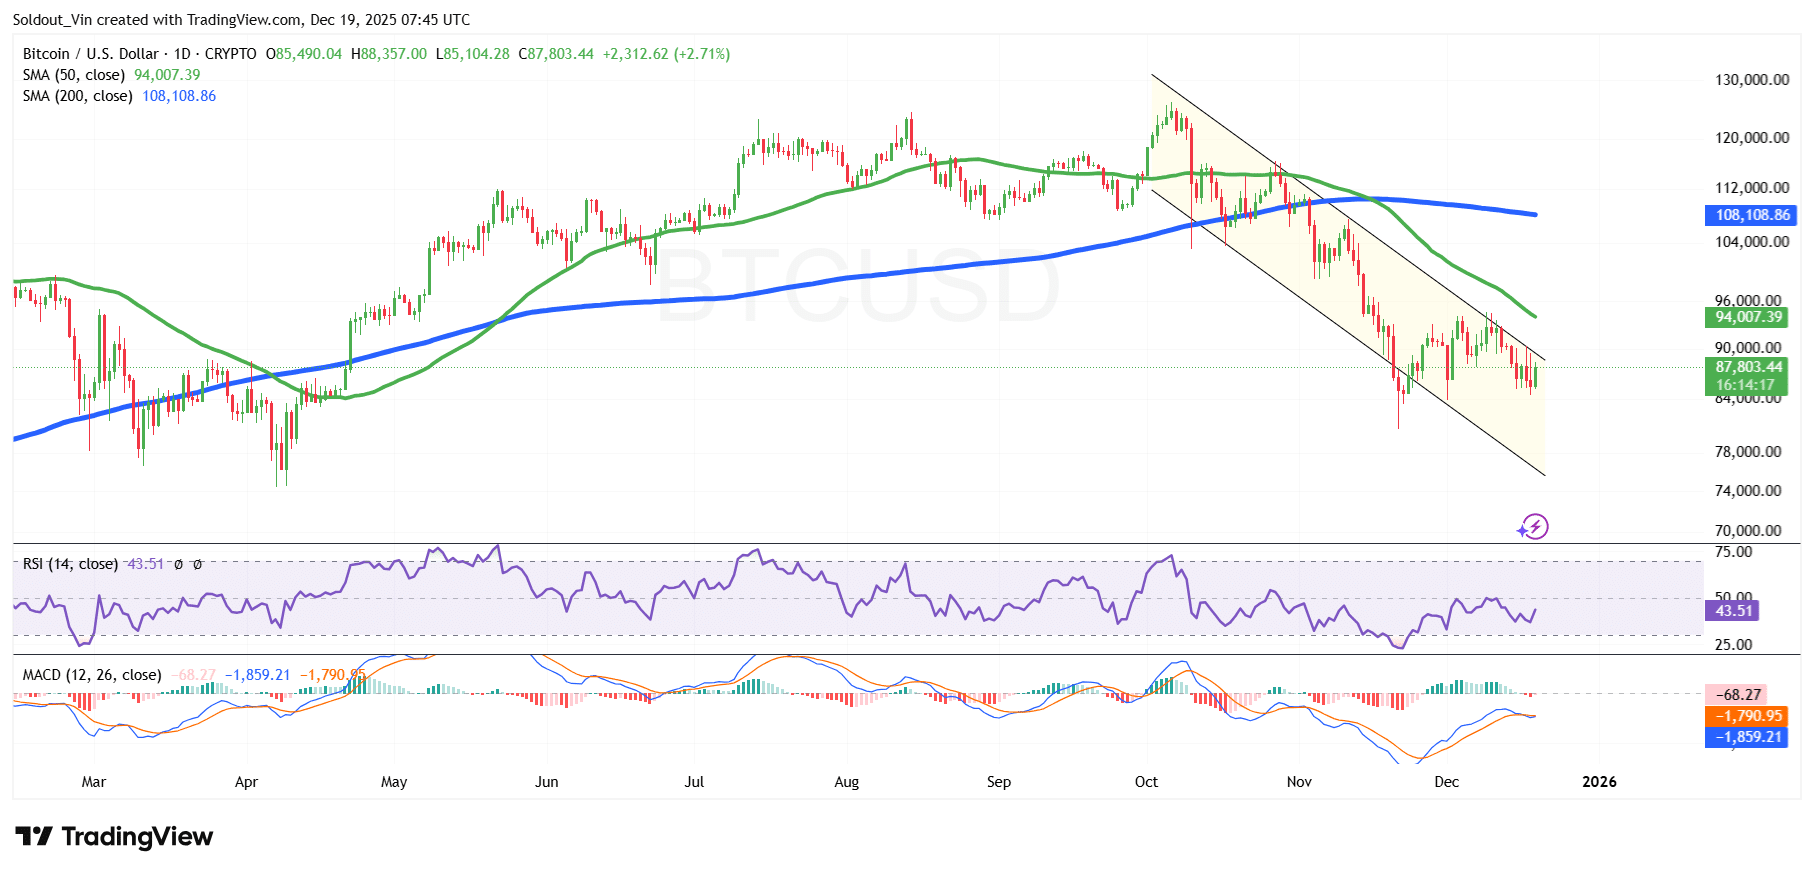
BTC price prediction
According to the BTC/USD chart analysis on the daily time frame, the BTC price is nearing a breakout above the descending channel pattern as it aims for a long-term bullish trend reversal.
If the price of BTC rises above the channel, the next target could be around the SMAs, first at $94,007 (50-day SMA) and $108,108 (200-day SMA).
However, the Moving Average Convergence Divergence (MACD) has turned negative, with the orange signal line crossing above the blue MACD line. The red bars on the histogram also begin to form below the zero line, a signal of negative momentum.
If the BTC price bears act on the negative momentum, the price could fall back to the lower limit of the channel and form support around $78,000.
Related news:
Best Wallet – Diversify Your Crypto Portfolio

- Easy-to-use, feature-driven crypto wallet
- Get early access to upcoming token ICOs
- Multi-chain, multi-wallet, non-custodial
- Now in the App Store, Google Play
- Stake to earn native token $BEST
- 250,000+ monthly active users
#Bitcoin #Price #Surpasses #Soft #CPI #BoJ #Rate #Hike