
Zcash has lost much of its last rally, but recent sessions show that traders are not giving up on the token.
The decline wiped out more than a quarter of its value, even as selling pressure has subsided. At the time of writing, the charts are showing a tight range, often indicating a trend towards accumulation as traders begin to test key support levels.
Zcash is approaching a possible turning point
ZEC has been among the weakest tokens in terms of performance over the past week. Heavy selling pushed the price lower day after day, yet a small change appeared as the candles shortened and volume thinned.
That change often indicates decreasing pressure from sellers. A smaller range also formed, creating an area where traders often look for signs of a recovery.
The token is now trading near several areas that previously caused strong reactions. Prices near these zones tend to attract both buyers and sellers as each group tries to take control.
This push and pull often influences the next short-term direction for assets that have just suffered heavy losses.
Technical signs that indicate exhaustion
Several measurements on the map now show that the descent can be tiring. The size of the candles during the slide has also become smaller. Volume also fell during late sessions, and these two changes often indicate sellers are becoming less aggressive.
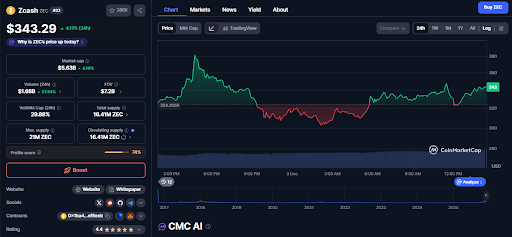
Buyers defended the $330 area two days in a row. That level matches past interest on the chart, making it an area that traders are revisiting.
ZEC also moved below the Fibonacci retracement level of 0.5 from its yearly highs, drifting towards the 0.382 level near $302.
The RSI fell for weeks and is now near a level that sometimes corresponds to a change in trend.
All this said, a daolu closing above $340 would argue for a rebound. That has happened, with ZEC now trading at $343. All the bulls need now is for assets to break out of the current consolidation band and continue higher.
Related reading: Zcash falls despite milestone move towards first ZEC ETF
Short-term scenarios for the next 24 hours
Traders look at two clear paths in the short term, based on nearby levels.
In the bullish case, a near-term increase could follow as buyers monitor the USD 330 zone and then push the price above USD 385. If trading volume grows during such a move, ZEC may move towards $400 and attempt to test the range from $525 to $545.
Such a move would confirm that the token has broken out of its tight range and is in an early recovery.
On the other hand, a break below $330 to $345 would expose the chart to a retest of $300. That area weighs heavily among traders due to past reactions. If the level fails, sellers could push the price to $270 or even lower.
Overall, a strong rebound from the $300 zone, supported by improved volume, could herald the path to recovery.
A big part of the next move will come from how the token behaves near the $330 and $300 zones.
#Zcash #rebound #move #Graphs #shift