
The
The drop in the price of the Ripple token came even after a solid launch by the Bitwise
🚨JUST ARRIVED: Bitwise’s place $XRP ETF launched on NYSE, potentially fueling long-term demand and attracting institutional interest. pic.twitter.com/XuNL885v1b
— RippleXity (@RippleXity) November 20, 2025
The launch of the XRP ETF created excitement in the community, but failed to provide significant support for the XRP price amid a selloff.
🚨BOOM: XRP ETFs from Bitwise, Franklin Templeton, 21Shares, Canary Capital and CoinShares just went live on the DTCC platform. 💥
Yes, they are officially on the list. The countdown to trading has begun. 🚀⏳ pic.twitter.com/De54AT8Q9R
— Diana (@InvestWithD) November 10, 2025
XRP price drops as whale sales reach XRP
The XRP price has been falling all week, pressured by whale investors throwing away their assets and retail traders fleeing in panic. Data shows that long-term investors, who previously held out during previous rallies, are now making their money as market activity increases.
Even small holders, typically those holding less than 100 This change marks a shift from optimism to fear among investors
Nearly 41.5% of all XRP is now at a loss, while only 58.5% of the supply is still profitable.
Now that the price of XRP has fallen to ~2.0, the 30D EMA of daily realized losses has increased to ~$75 million per day. This is the highest level since April 2025.
📉 https://t.co/PGos9nG5gq https://t.co/wzKcbqNWHh pic.twitter.com/3klLOf0yUi
— glassnode (@glassnode) November 21, 2025
That is the weakest position since November 2024, when XRP reached $0.53. Profit-taking after major ETF launches is quickly becoming the norm.
On-chain statistics also show that the supply of profits is falling, short-term hodlers are quickly leaving, and many wallets are returning coins to exchanges. When more XRP moves from wallets to exchangesthis often indicates that holders are preparing to sell, not buy.
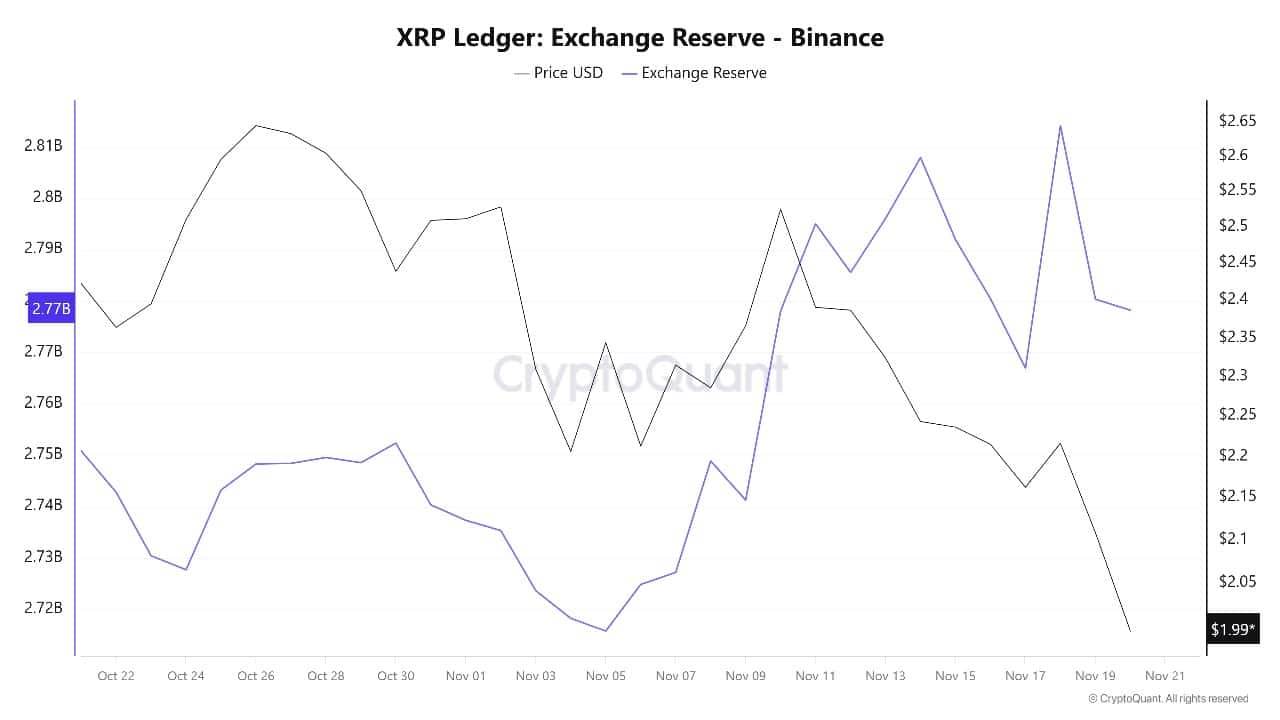
XRP Ledger Exchange Reserve Source: CryptoQuant
This behavior keeps prices under pressure during market downturns and makes it harder to bounce back, even with positive developments like the launch of Bitwise XRP ETF.
Technical Analysis of XRP Price: Key Support and Resistance Levels
The
The next major support zone is between $1.85 and $2.00, marked by the yellow band on the chart. This area saw strong buy interest earlier this year and could attract new buyers if the price stabilizes

XRPUSDT Daily Chart Analysis Source: Tradingview
Above that, resistance is around $2.45-$2.62, with the 50-day and 200-day SMAs poised to block any rebounds. If XRP can reclaim this area, a rise to $2.71 (the 23.6% Fibonacci retracement) would be possible, but selling pressure remains strong.
The previous highs of $3.40 and $3.66 are some way off and unlikely in the near term unless sentiment changes soon.
Key indicators confirm a negative outlook. The Relative Strength Index (RSI) has fallen to 31, indicating that XRP is heavily oversold but not yet signaling a reversal. The MACD (Moving Average Convergence Divergence) indicator is bearish, with the blue MACD line below the orange signal line and both in negative territory, highlighting the dominance of sellers.
If the price fails to hold above $1.85, further losses towards $1.60 or even the 78.6% Fibonacci retracement near $1.11 could come quickly. The next major support is $0.48, last seen during extreme fear periods in late 2024
For now, the outlook for XRP remains cautious. Short-term dips may provide opportunities for brave buyers, but the trend remains negative.
Related articles:
Best Wallet – Diversify Your Crypto Portfolio

- Easy-to-use, feature-driven crypto wallet
- Get early access to upcoming token ICOs
- Multi-chain, multi-wallet, non-custodial
- Now in the App Store, Google Play
- Stake to earn native token $BEST
- 250,000+ monthly active users
#XRP #Price #Drops #Launch #Bitwise #XRP #ETF