
The XRP price faces heightened downside risks due to massive outflows from US Spot XRP exchange-traded funds (ETFs) amid risk-off sentiment in the broader crypto market.
Rising US and Japanese bond yields indicate macroeconomic stress, pushing the total crypto market capitalization 32% below its October 2025 peak.
BTC, ETH and
The possible tariffs are an attempt by the government to convince Denmark to reconsider its control over Greenland.
The S&P 500 index fell 1.9%, while gold prices rose to a new all-time high of about $4,885/ounce, and the crypto market cap fell to $3 trillion from nearly $3.2 trillion, according to Coingecko facts.
XRP is down nearly 1% over the past 24 hours, trading at $1.90 as of 4:39 a.m. EST, with an intraday low of around $1.89.
Spot XRP ETFs record $53.32 million in net outflows
According to Coin glass dataspot
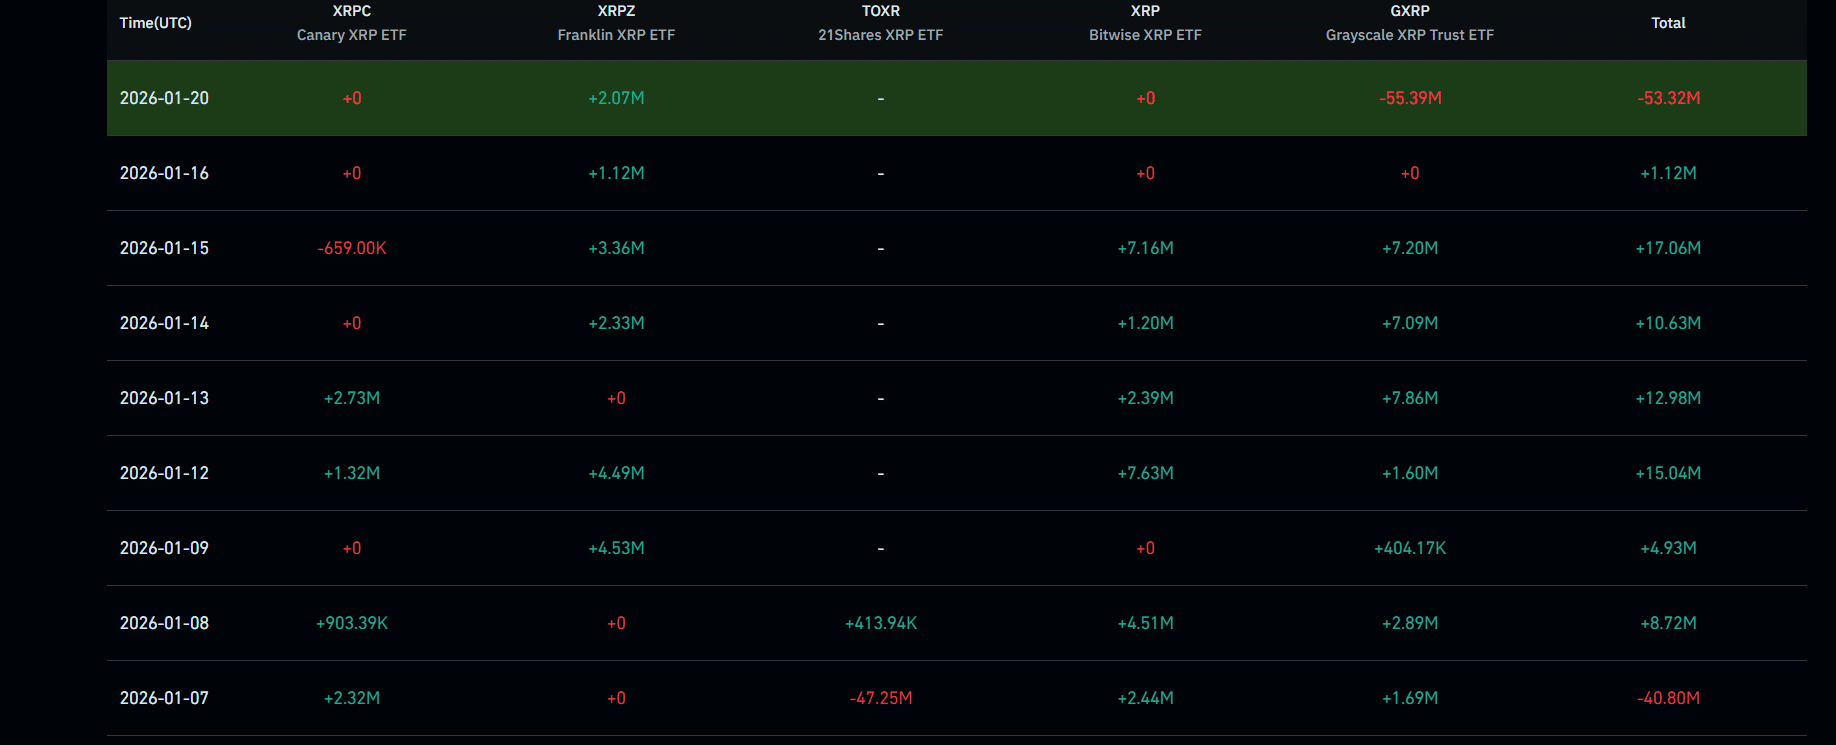
The outflows came from Grayscale’s GXRP ETF, which recorded total outflows of $55.39 million. Meanwhile, Franklin’s XRPZ recorded inflows of $2.07 million.
After the latest outflow, total net inflows since launch now stand at $1.22 billion.
The recent bearish period was not unique to XRP, as most other crypto ETFs also saw outflows. Specifically, the BTC ETFs recorded outflows of $479.70 million, while the ETH ETFs recorded $230 million.
Can XRP stabilize or is there more downside ahead?
The The price remains well below the 50-day SMA at $2.39, underscoring continued bearish pressure over the medium term.
After peaking near the $3.60-$3.70 region, XRP entered a prolonged correction phase, forming a descending channel pattern.
Despite this, XRP has so far managed to defend the $1.85-$1.90 zone, an area that also aligns with a key Fibonacci extension level from the previous advance.
The 50-day SMA continues to trend down, indicating that trend momentum has not yet shifted in favor of the bulls. As long as the price of XRP trades below this SMA.
On top, the $2.20-$2.40 region stands out as a heavy resistance band, combining the falling channel top and the 50-day SMA.
XRP’s Relative Strength Index (RSI) is currently hovering around 41, below the neutral level of 50. This indicates weak momentum, although the RSI is not yet deeply oversold.
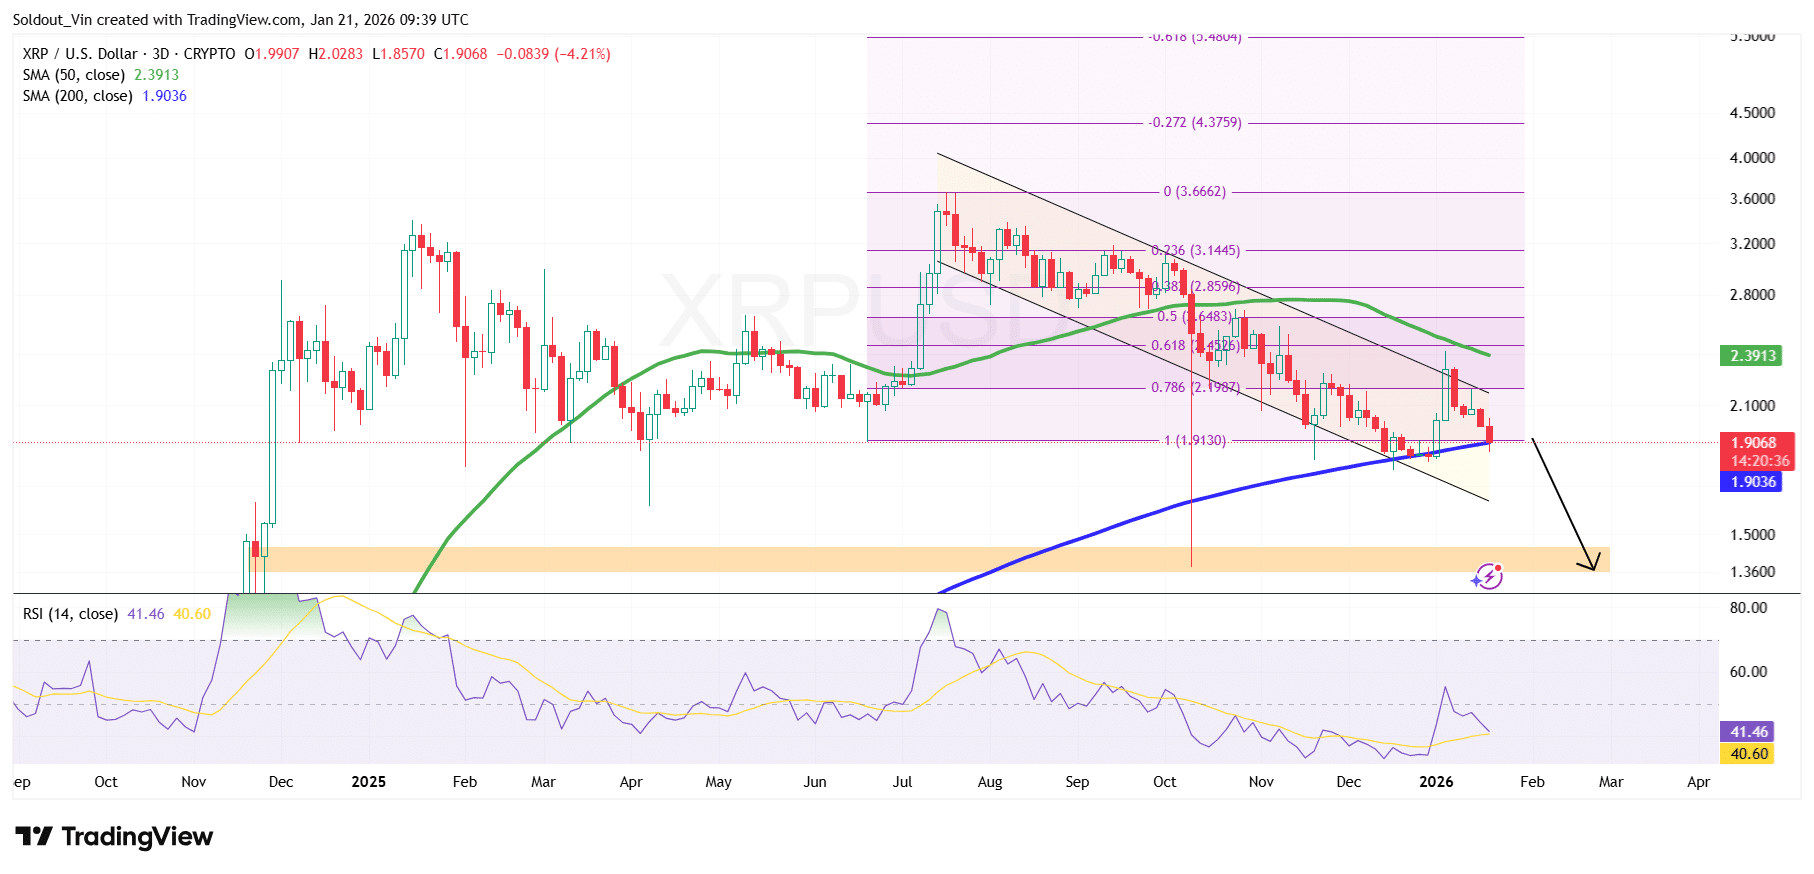
The higher timeframe XRP/USD chart suggests that the Ripple token could attempt a short-term stabilization above the $1.85-$1.90 support zone given its confluence with the 200-day SMA. A continued hold at this point could allow another corrective move towards $2.10–$2.30, where previous breakout levels and channel resistance meet.
A decisive daily or multi-day close above the $2.30–$2.40 region would be needed to weaken the bearish structure.
On the other hand, a clear break below the 200-day SMA and $1.85 support would significantly change the bearish structure. As a result, XRP could slide into the $1.35 to $1.50 demand zone.
Related news:
Best Wallet – Diversify Your Crypto Portfolio

- Easy-to-use, feature-driven crypto wallet
- Get early access to upcoming token ICOs
- Multi-chain, multi-wallet, non-custodial
- Now in the App Store, Google Play
- Stake to earn native token $BEST
- 250,000+ monthly active users
#XRP #ETFs #post #record #outflows #Ripple #extends #price #decline