
RED ZONE: The tomato price factor in inflation monitoring | Photo credit: DEEPAK KR
The accompanying table shows the forecasts for both GDP and inflation for FY26 as per the RBI’s survey of professional forecasters. The movements are interesting.
The research for the April forecasts would have been conducted a month earlier, meaning it was before the tariff news from the US. The background may have had more to do with the budget’s impact on spending and tax cuts, as well as the interest rate cuts pushed for by the Reserve Bank of India. The GDP forecast then dropped to 6.3 percent and remained almost flat in August (before the additional tariff was imposed), before rising to 6.7 percent (even though there was no deal in sight with the US). The forecast for December is probably around 7 percent or even higher. Intuitively, because all of these numbers are average predictions, there are several numbers that are both higher and lower than this figure.
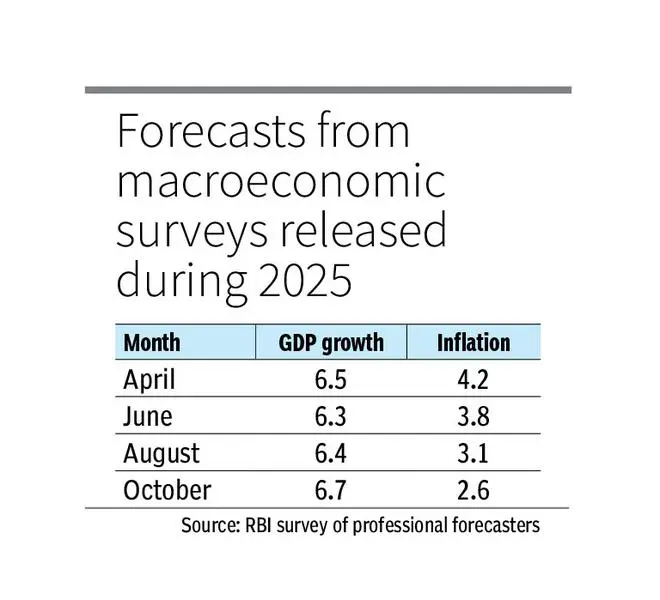
The inflation trajectory was fairly unequivocal, declining over time from 4.2 percent to 2.6 percent. The figure for December could likely be even lower, with some forecasts keeping it below 2 percent.
Does this mean that predictions are completely meaningless when there are such fluctuations in the numbers? This is important because such predictions form the basis of any company’s business strategy. All demand forecasts are based on the GDP growth rate, while pricing and cost formulation depend on inflation forecasts. Monetary policy is discussed based on this number, which can lead to changing rationales for action. On this point, the RBI has been cautious by looking at the current inflation numbers and keeping an eye on future numbers as the policy needs to be forward-looking. But what if those predictions also change?
Why have inflation forecasts gone horribly wrong? All models would have assumed a normal monsoon for the year and a good harvest. Forecasters are also aware that price indices were high in 2024 (the base) and would lead to low inflation in 2025. The only intervention came in the form of rationalization of VAT, which would affect manufactured products more than food. Moreover, the impact would be felt from October to November. But surprisingly, forecasts for core inflation, which excludes food, beverages and fuel, are more stable at around 4 percent.
The problem is that all models use past data as a basis for assumptions about how the variable factors move. The most volatile element has thus been food prices, where the previous relationship between production and price movements has not held, leading to an overestimation of inflation. The problem is exacerbated by base effects, which make some inflation figures less credible. For example, tomatoes have always been a problem component with a weight of 0.57 in the CPI. In October 2023, it averaged ₹30 per kilo and rose to ₹64 in October 2024, leading to a very high inflation rate. In October 2025 this was ₹ 38 per kilo, which is still more than 20 percent higher than in 2023. So models would often go wrong.
A similar picture emerges for the WPI components on the food side. As these indices have moved towards zero or become negative, they also tend to impact GDP growth rates. The components of GDP are calculated at current prices and then deflated by inflation rates to arrive at real GDP, which reflects how broadly total production of goods and services has grown after price effects have been removed. With inflation deflators low, it makes sense that real and nominal GDP growth rates have started to move asymptotically closer together. This has led to an increase in GDP growth forecasts. Therefore, lower inflation forecasts go hand in hand with higher real GDP growth forecasts.
As a layman you might wonder why the forecaster could not have foreseen this anomaly. The answer is that it would not have been possible to estimate such low inflation rates, which would lead to constant changes based on adaptive expectations. The relationship between nominal and real GDP has rarely been discussed, as there has been a constant difference of 3 to 4 percent.
This base effect syndrome would also play a dominant role in FY27, if the roles are reversed. The low inflation rate of, for example, 0.3 percent in October 2025 will statistically lead to a much higher rate in the 3 to 4 percent range, even if there are no food price shocks. By the same logic, GDP growth rates would generally weaken as the gap between nominal and real GDP rates widens and price deflators become more realistic. A reversal of fortunes?
(The writer is Chief Economist of Bank of Baroda. Opinions are personal)
More like this
Published on November 24, 2025
#predictions #wrong