What does your day look like? This is how Australians spend their time

What does your day look like? This is how Australians spend their time

4 minutes, 55 seconds Read

According to new data from the Australian Bureau of Statistics (ABS), women spend more than an hour more per day on unpaid work than men and are more likely to feel rushed or short of time.
The ABS’ Time Use Survey 2024, released on Wednesday, offers new insight into how Australians divide their day.
It reveals some interesting gender differences when it comes to rest and chores.
On average, Australian respondents spent 10 hours and 43 minutes on personal care, including sleeping, eating, health and hygiene.
Eight hours and twenty minutes were spent on work and education, while four hours and 25 minutes were spent on unpaid household activities, such as childcare.
When it comes to leisure and relaxation, Australians spend 5 hours and 34 minutes on leisure activities such as socializing, exercising, watching TV and reading.

The data was collected from 10,673 people in 6,939 households, yielding a total of 19,319 diary days in which activities were recorded.

Source: SBS news / Australian Bureau of Statistics

The survey was conducted over two periods: between July 22, 2024 and September 3, 2024 and September 16, 2024 and October 29, 2024.

Unpaid work

The survey found that 90 percent of women and 81 percent of men did unpaid work every day.
Women reported 4 hours and 53 minutes of unpaid work per day – about an hour more than men, who recorded 3 hours and 52 minutes.
Parents of children under the age of 15 spend significantly more time on unpaid work than people in other living situations.

Single parents took an average of 7 hours and 4 minutes, while couples took an average of 6 hours and 16 minutes – compared to the overall average of 4 hours and 25 minutes.

Domestic activities

Domestic activities include unpaid work to maintain and manage a household, excluding caring responsibilities.

More women (86 percent) reported doing household activities every day than men (75 percent).

The most common activities were cooking (69.1 percent of women compared to 53.8 percent of men), housework (56.9 percent of women and 34.8 percent of men) and shopping (25.8 percent of women and 18.3 percent of men).

Caring for children

Caring for children under 15 years of age includes activities such as personal care, playing with children or helping with homework. Accompanying care is measured separately.
Female parents (88 percent) were more likely to report caring for their children than male parents (72 percent).
On average, female parents spent 4 hours and 38 minutes a day caring for their children – more than an hour longer than male parents, who spent an average of 3 hours and 29 minutes.

Meanwhile, supervisory care refers to the time spent in the same location as a child under the age of 15, while being available to provide care as needed, in addition to another main activity.

Nearly a quarter of people (23 percent) report providing supervisory care while performing another activity, an average of seven hours and eight minutes per day. Women (25 percent) were more likely to provide supervisory care than men (21 percent).
Nearly a quarter (22 percent) report supervising a child while also doing unpaid work, an average of 2 hours and 49 minutes.

Only nine percent of people reported supervising a child while doing paid work, an average of 5 hours and 41 minutes per day. Women (10 percent) did this more often than men (8 percent).

Employment activities

Employment activities include paid work and travel to and from work.

More men participated in work activities than women (48 percent compared to 38 percent).

Men who were employed spent almost an hour longer per day than women, an average of 8 hours and 55 minutes, compared to 7 hours and 58 minutes.

Working from home

On workdays, people who worked from home spent less time on paid work.
Those who worked from home had an average of seven hours and eight minutes of paid work, compared to eight hours and eighteen minutes for those who did not.
People who worked from home also spent about an hour longer on unpaid work (3 hours and 24 minutes) than those who did not (2 hours and 26 minutes).

On days when they worked from home, women spent more time on unpaid work than men: 3 hours and 48 minutes compared to 3 hours and a minute.

People who worked from home on their calendar day spent about an hour longer on unpaid work during their day (3 hours and 24 minutes) than people who did not work from home (2 hours and 26 minutes).
Working from home was also associated with more free time.
Women who worked from home spent 3 hours and 35 minutes on leisure activities, compared to 3 hours and 10 minutes for those who did not.

Men who worked from home spent 4 hours on leisure time, compared to 4 hours and 24 minutes for those who didn’t.

Spare time

Leisure activities include activities undertaken for pleasure or personal fulfillment, such as watching television, exercising or socializing.
Most people (91 percent) took part in leisure-time activities, with men taking an average of 5 hours and 48 minutes and women taking 5 hours and 21 minutes.

Parents spent significantly less time on leisure activities (3 hours and 38 minutes) than people without children (6 hours and five minutes).

Watching or streaming television was the most common activity, with 62 percent of people spending an average of 2 hours and 55 minutes per day.
Talking or socializing in person lasted an average of 2 hours and 19 minutes. About 24 percent of men indicated that they had an average of 2 hours and 25 minutes of personal contact, while 30 percent of women said this was slightly shorter on average, namely 2 hours and 15 minutes.

Social media use, surfing the internet and checking emails were also common, with a quarter of respondents spending an average of one hour and 23 minutes per day on these activities.
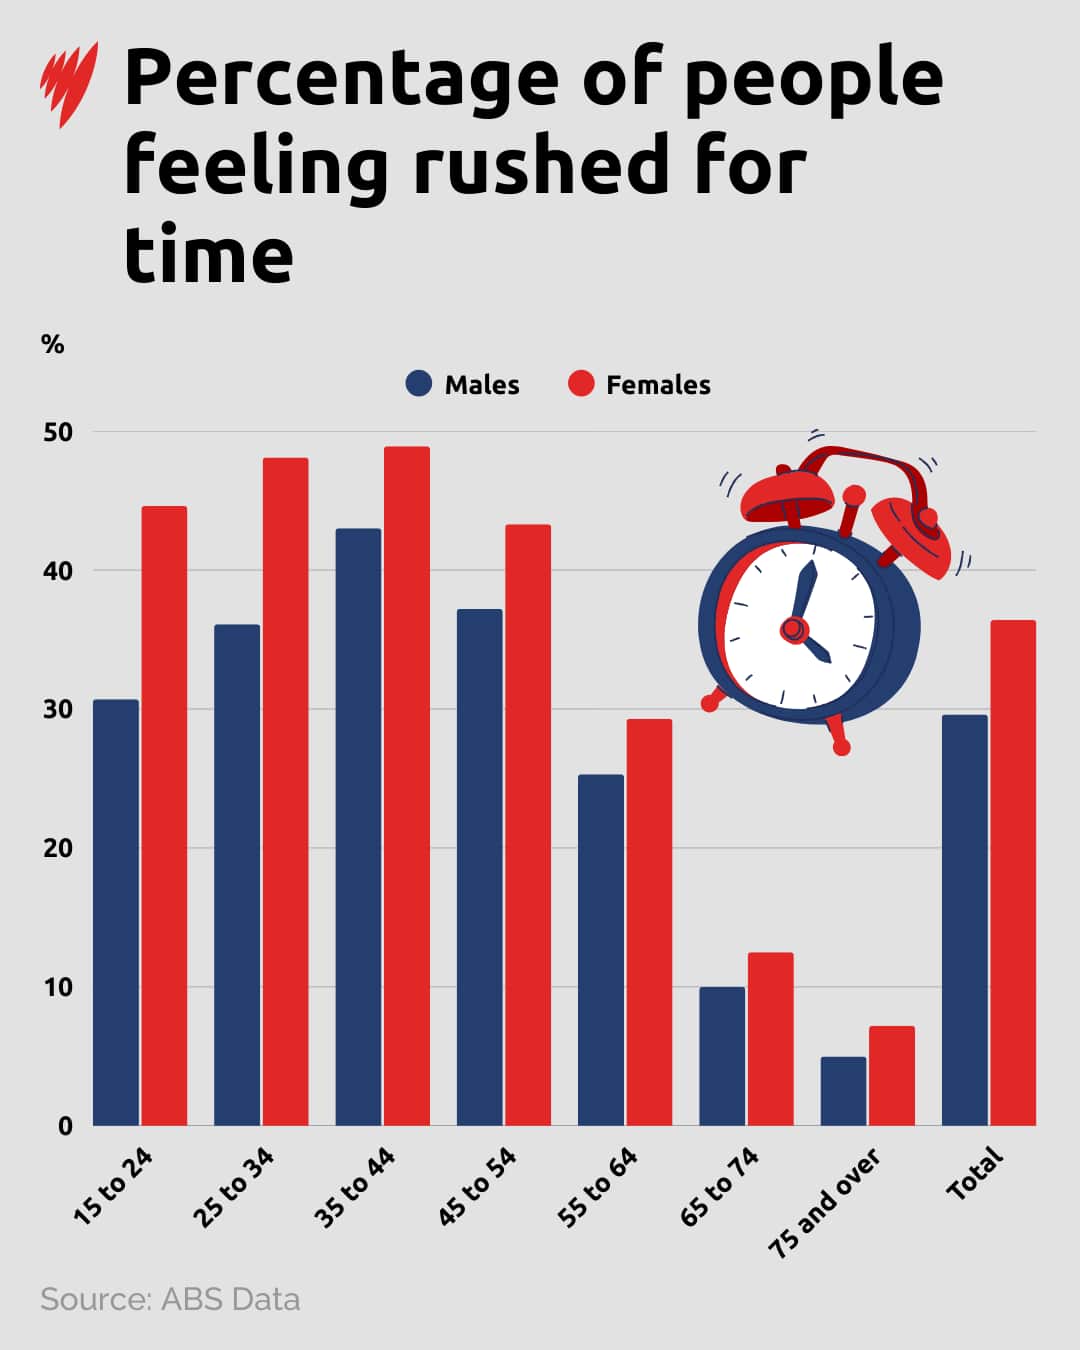
Time stress

A third of respondents (33 percent) said they always or often felt rushed or under time pressure, with this percentage being higher among women (36 percent) than men (30 percent).

Balancing work and family was the most commonly cited reason, reported by 42 percent of those who felt time stressed.

171225 ABS TIME DATA-FEELING RUSHED.png

Source: SBS news / Australian Bureau of Statistics

Nearly half of women aged 35 to 44 (49 percent) said they always or often felt rushed or short of time.

People in couple families with children under the age of 15 (51 percent) felt rushed significantly more often than couples without children (26 percent).

#day #Australians #spend #time

Similar Posts

Leave a Reply

Your email address will not be published. Required fields are marked *