
Solana price rose 1% over the past 24 hours to $143.28 at 2:28 a.m. EST, while trading volume fell 28% to $5.5 billion.
This comes as Solana Mobile said its SKR token, linked to its Seeker phone, will launch early next year, with a total supply of 10 billion tokens, of which 30% will be allocated for airdrops and 25% for growth and partnerships.
Search and you will find.
SKR is coming in January 2026 🧵 pic.twitter.com/cwtlp8G8Zf
— Seeker | Solana Mobile (@solanamobile) December 3, 2025
Of the total offering, 10% will be liquidity, 10% for a community fund, 15% for Solana Mobile and 10% for Solana Labs.
SKR tokens use a linear inflation model to incentivize early participants to secure the ecosystem via staking and drive platform growth.
The inflation rate over the first year is 10%, with a decay mechanism that reduces this by 25% annually until it stabilizes at a final rate of 2%.
Meanwhile, U.S. Spot SOL ETFs (exchange-traded funds), according to data from SoSoValue, recorded daily net inflows of $45.7 million on Monday.
Now that Solana price is in recovery mode, can the price go up?
Solana Price ready for a breakthrough
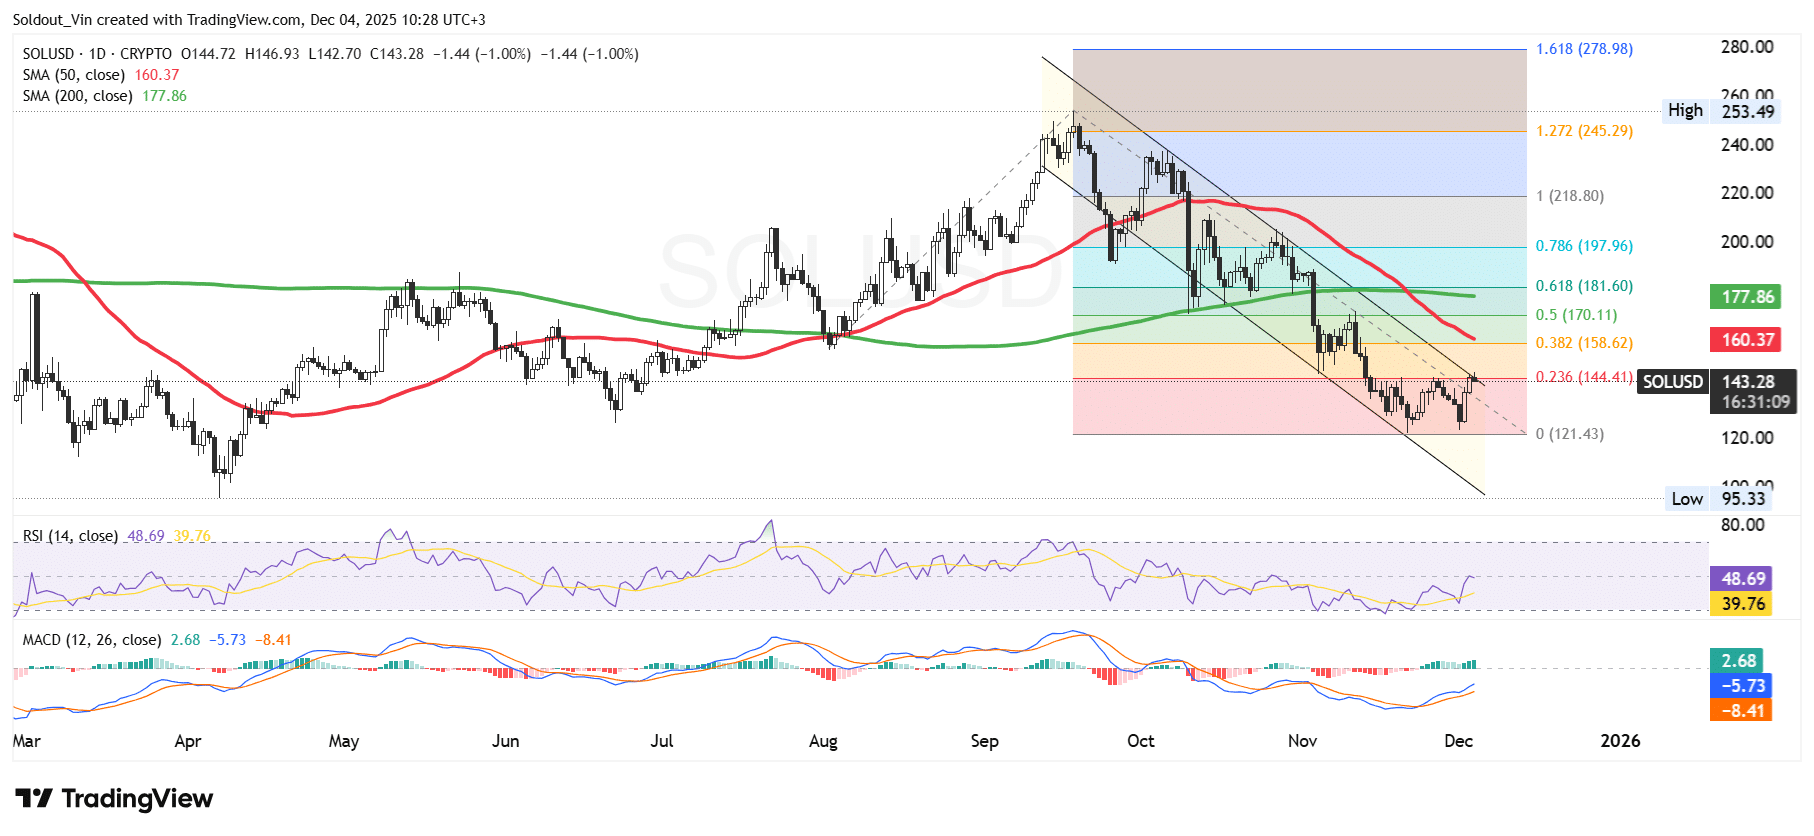
After trading in a sideways pattern around the $160 level from May to August, the SOL Award then rose to $252 in September.
However, after reaching this zone, the bears took control of the Solana price, driving it through a descending channel pattern and crossing and breaking the key support levels of the Fibonacci Retracement chart.
The area around $122 at the 0 Fib level provided important support for the price of SOL, pushing it into a recovery. SOL is currently trading within the upper limit of the descending channel as bulls eye a possible breakout.
As the downtrend continues, the Solana token price has traded below both the 50-day and 200-day Simple Moving Averages (SMAs), indicating that sellers have maintained control. The downtrend was also pushed by a deathcross around $180.
Meanwhile, the Relative Strength Index (RSI) is showing signs of recovery, with the RSI climbing towards the 50 midline, currently at 48, which is a key signal that buyers are gaining momentum.
The Moving Average Convergence Divergence (MACD) also indicates that buyers are intervening as the blue MACD line has crossed above the orange signal line. Green bars also form on the histogram above the zero line, indicating that SOL has positive momentum.
SOL price prediction
According to the SOL/USD chart analysis on the daily time frame, Solana price is poised for a sustained bullish recovery above the descending channel.
If Solana price breaks out and crosses the Fib 0.382 level at $158.62 and the 50-day SMA at $160.37, the next major resistance level will be the 200-day SMA at $177.86.
Conversely, if the bears take the lead at this level, under pressure from the negative SMA indicators, SOL price could drop below the channel again, with the next key support at $110.
Related news:
Best Wallet – Diversify Your Crypto Portfolio

- Easy-to-use, feature-driven crypto wallet
- Get early access to upcoming token ICOs
- Multi-chain, multi-wallet, non-custodial
- Now in the App Store, Google Play
- Stake to earn native token $BEST
- 250,000+ monthly active users
#Solana #price #rises #Solana #Mobile #confirms #SKR #launch