
SEI falls to $0.132-$0.14 zone as open interest declines after liquidity crunch
SEI/USD on the 1-hour chart shows a strong V-shaped recovery from 0.118 to above 0.142, driven by sharp pressure on the day.
After the peak, the price gradually shifted down towards the 0.132 area, indicating that the aggressive upward move has weakened.
The chart now shows lower highs and lower lows, reflecting short-term bearish control as the market unwinds the liquidity spike.
Source: Open interest
Aggregate open interest (OI) fell sharply during the initial sell-off but expanded rapidly during the vertical recovery, indicating a strong increase in leveraged positioning as the price accelerated upward. Since then, OI has fallen as price softened, indicating previous positions are being closed or exited rather than new commitments being formed.
This simultaneous decline in price and OI typically corresponds to a cooling market environment in which traders reduce their exposure following a volatility-induced event.
With no new OI expansion accompanying the pullback, conditions currently favor stabilization over high-momentum continuations, and market behavior is focusing on whether the previous sell-off lows can remain intact.
SEI of $0.14 with a market cap of $863.40 million and a volume of $64.37 million
According to data from BraveNewCoin, the coin is trading at $0.14, down 3.27% in the last 24 hours. The asset’s range has remained tight, with a low of $0.14 and a high of $0.14, reflecting low volatility compared to the previous session’s intraday swings.
The token currently has a market cap of $863.40 million, backed by an available supply of 6.37 billion tokens. Daily trading volume stands at $64.37 million, consistent with a moderate liquidity phase after the previous volatility spike.
The asset remains 88.07% below its all-time high of $1.14 recorded on March 16, 2024, putting it within a long-term corrective structure that has driven much of the price action over the 2024-2025 period. Despite stable liquidity and consistent exchange rate activity, the market continues to operate within a broader downtrend formed by lower longer-term highs.
SEI in medium-term downtrend while momentum indicators remain neutral
On the other hand, SEI/USDT on the daily chart remains in a clear medium-term downtrend, after peaking near 0.39, with the price now consolidating around 0.13, just above the previous significant low at 0.068.
Recent candles have shown narrow bodies and tight margins, indicating consolidation rather than a decisive trend shift.
The overall structure continues to form lower highs and lower lows, confirming a continued downward trend.
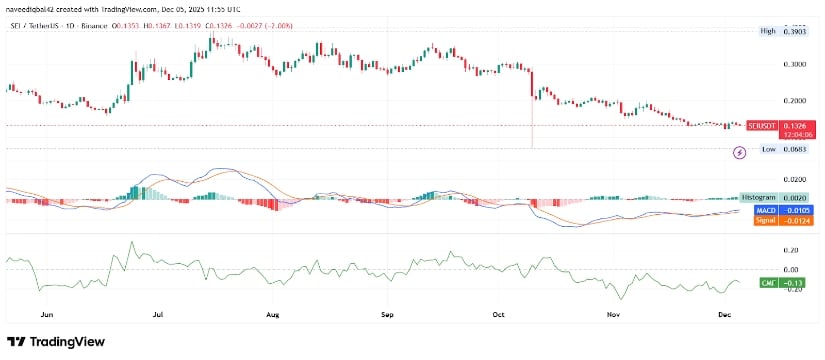
Source: Trading view
The MACD line is slightly below the signal line and both are near the zero level. This reflects weak bearish momentum and a lack of trend strength on either side. The histogram has turned slightly positive, showing an early attempt at upward momentum, although the signal remains vulnerable without a confirmed crossover or strong volume support.
The Chaikin Money Flow (CMF) remains negative, showing that capital outflows continue even as the price moves sideways. This combination of negative money flow, neutral momentum and a broader downtrend is consistent with a cautious technical backdrop, with the market still lacking the structural signals and volume strength that typically accompany a sustained trend shift.
#Sei #Price #Prediction #Pulls #Open #Interest #Declines #Sharp #Pressure #Brave #Coin