
Ethereum price rose more than 2% over the past 24 hours, trading at $3,039 at 3:03 a.m. EST, with trading volume rising 132% to $18.3 billion.
ETH broke the $3,000 level in a relief rally even after the summary of Bank of Japan (BoJ) opinions from the December policy meeting reinforced expectations of continued tightening in 2026.
The BoJ raised its policy rate from 0.50% to 0.75% at its December policy meeting, the highest level in thirty years. The summary of the advice released early Monday shows that some board members see the need for further rate increases in the near future.
🇯🇵BOJ BECOMES MORE HAWKISH😭
Bank of Japan minutes show debate on MORE rate hikes after December.
The policy rate is now 0.75% (the highest in 30 years), but officials say it is still well below neutral.
Facts:
– Inflation > 2% for ~4 years
– The real interest rate is still negative
– Some ask for walks… https://t.co/Otlg6DhtDR pic.twitter.com/93i4fCT5nM— Geldaap (@TheMoneneyApe) December 29, 2025
Some board members believe current rates are still lower than what they should be when adjusted for inflation.
Economists predict a rate between 1.25% and 1.5% in 2027.
The crypto market has fallen significantly due to BOJ policy changes in the past.
Can the projections affect the price of Ethereum?
Ethereum price indicators support a bullish reversal after a consolidation
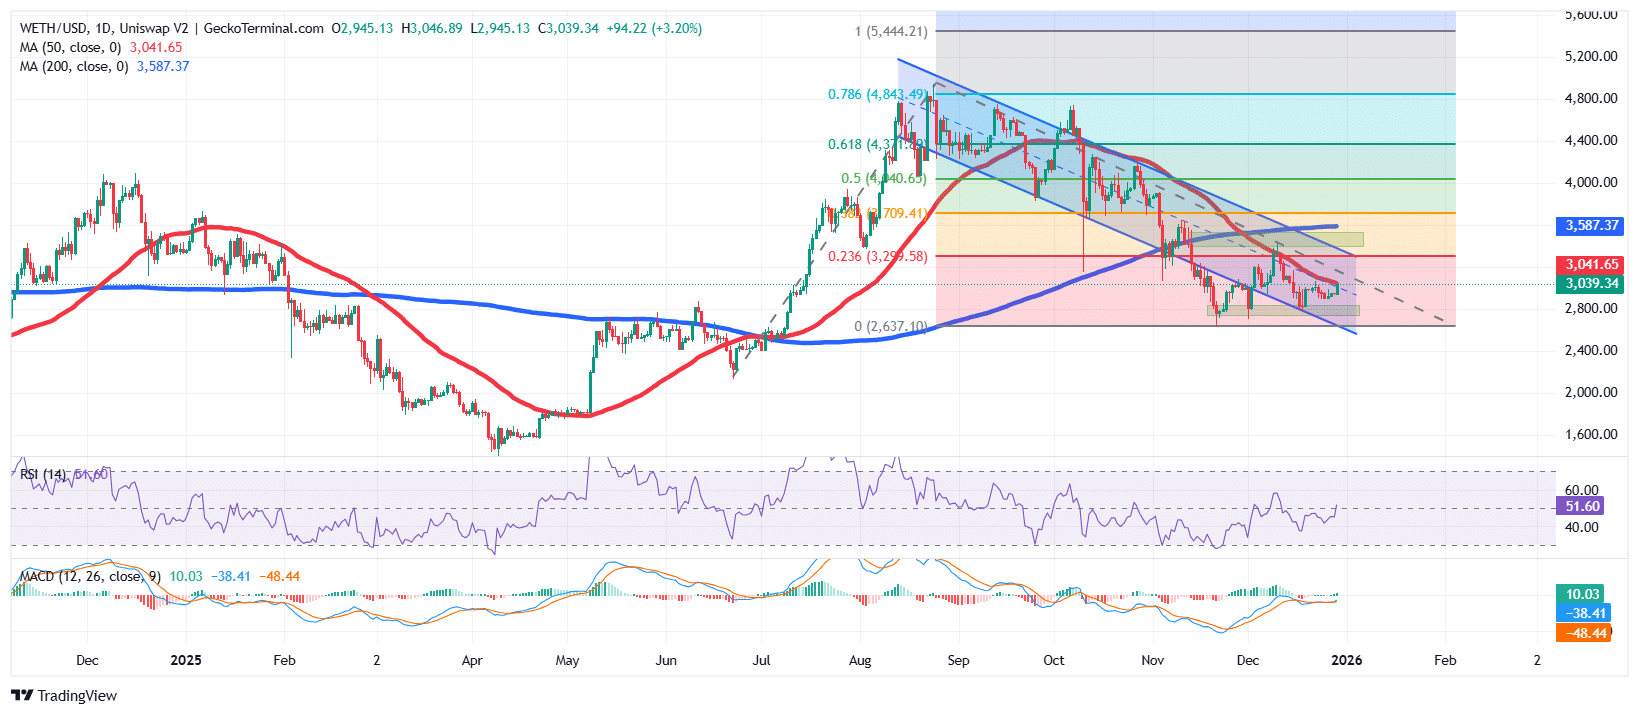
According to the ETH/USD chart analysis on the daily chart, the ETH price is still trading within a consolidation zone between the USD 3,400 resistance and the USD 2,650 support, with investors picking up a cautious trend.
As evidenced by the trend-based Fibonacci Retracement levels, Ethereum price rose mid-year, pushing ETH to an all-time high (ATH) of around $4,940 in September. After the rise, the bulls were unable to sustain the uptrend, after which the price of ETH fell within a descending channel pattern, breaking the key support levels for Fib.
However, after hitting support around $2,650, ETH moved into a sideways pattern, bounded by the $3,400 resistance area.
The ongoing downtrend was further supported by Simple Moving Averages (SMAs) forming a deathcross around $3,545. Ethereum’s price has since traded below both the 50 and 200 day SMAs.
The short-term projection shows that Ethereum price is poised for an increase as it heads towards the 50-day SMA ($3,041).
Meanwhile, key indicators support this bullish scenario, with the Relative Strength Index (RSI) rising above the 50 midline level, currently at 51.60.
The Moving Average Convergence Divergence (MACD) also supports this outlook, with the blue MACD line crossing above the orange signal line. Above the neutral line, green bars also begin to form on the histogram, a signal of positive momentum.
ETH price prediction
The last candle on the daily time frame shows that ETH price is currently gearing up for a rise as it approaches the 50-day SMA and acts as the immediate resistance area.
If the ETH bulls maintain the rally above the $3,000 area and close the 50-day SMA, the next major resistance area and target lies within the 0.236 Fib area at $3,299. A sustained rally could then push Ethereum’s price towards the previous supply zone at $3,709.
Conversely, if ETH’s price continues to trade within a descending channel to break below the $2,800 support, the next cushion against downside pressure is at the $2,400 support area, below the current support.
This could be the case if spot ETH exchange-traded funds (ETFs) continue to lose. More than $32 million worth of Ethereum was sold by ETFs last week, according to data from Ali Martinez at X.
$32 million in Ethereum $ETH was sold by ETFs last week. pic.twitter.com/EnTqbAQ6Zj
— Ali Charts (@alicharts) December 28, 2025
Related news:
Best Wallet – Diversify Your Crypto Portfolio

- Easy-to-use, feature-driven crypto wallet
- Get early access to upcoming token ICOs
- Multi-chain, multi-wallet, non-custodial
- Now in the App Store, Google Play
- Stake to earn native token $BEST
- 250,000+ monthly active users
#Ethereum #Surpasses #Emergency #Rally #Signals #BOJ #Rate #Cuts